 Purple Sector
How to analyse RaceBox data
Read RaceBox data step by step: lap list, two laps side by side, speed through the corners, then a time gap at every turn from a VBO export on a PC or Mac.
To analyse RaceBox data, start in the RaceBox app: it shows every lap with speed and g-force graphs, the driving line and sector times, and compares two laps side by side. For a running time gap at every corner on a computer, export the session from racebox.pro as VBO or CSV and open it in lap analysis software such as Purple Sector. Compare your best lap with a typical lap, find where the gap grows, then read the speed there.
Purple Sector is one of the tools on this page. Purple Sector has no commercial relationship with RaceBox or any other brand on this page.
What do I need?
- A session recorded with a RaceBox Mini, Mini S or Micro and the RaceBox app. The RaceBox app needs RaceBox hardware; it does not work with the phone’s own GPS.
- For the computer steps, the session as a VBO or CSV file. See getting the file off a RaceBox.
The screenshots below are Purple Sector with the public Norwell sample open: a VBOX session, opened as a VBO, the same format racebox.pro exports.
1. Which laps can I compare?
Open the session overview first: the RaceBox app lists lap times, cornering g-forces and maximum speeds. Leave out the out lap, the in lap and any lap with traffic, a spin or a yellow flag. What’s left are the laps you can compare.
If sessions are missing from the website, RaceBox’s advice is to open the app with an internet connection but without connecting the device; it uploads them within a few minutes.
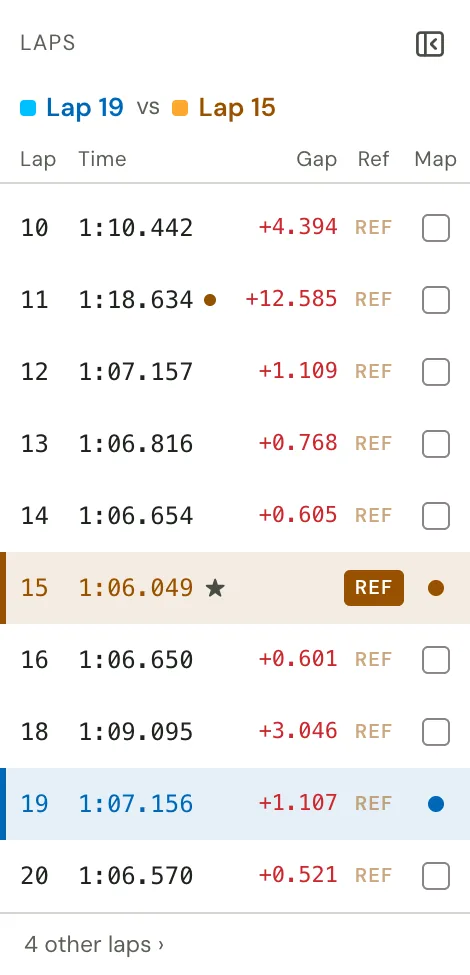
2. Which two laps?
Use your best lap as the reference and one typical lap from the same session to compare with it. The RaceBox app puts two laps side by side to show where time is gained or lost, and plots speed and acceleration forces around the lap.
3. Where is the time going?
Look at the sector times first: the sector where the typical lap is furthest behind is where to look. RaceBox’s own pages describe sector times, the side-by-side comparison and a live predictive timer while driving; they don’t describe a time-gap graph after the session.
For a running time gap along the whole lap, export the session from racebox.pro and open it in lap analysis software. In Purple Sector the gap to your best lap shows at every turn: where it climbs, the typical lap is losing time; where it falls, it’s gaining.
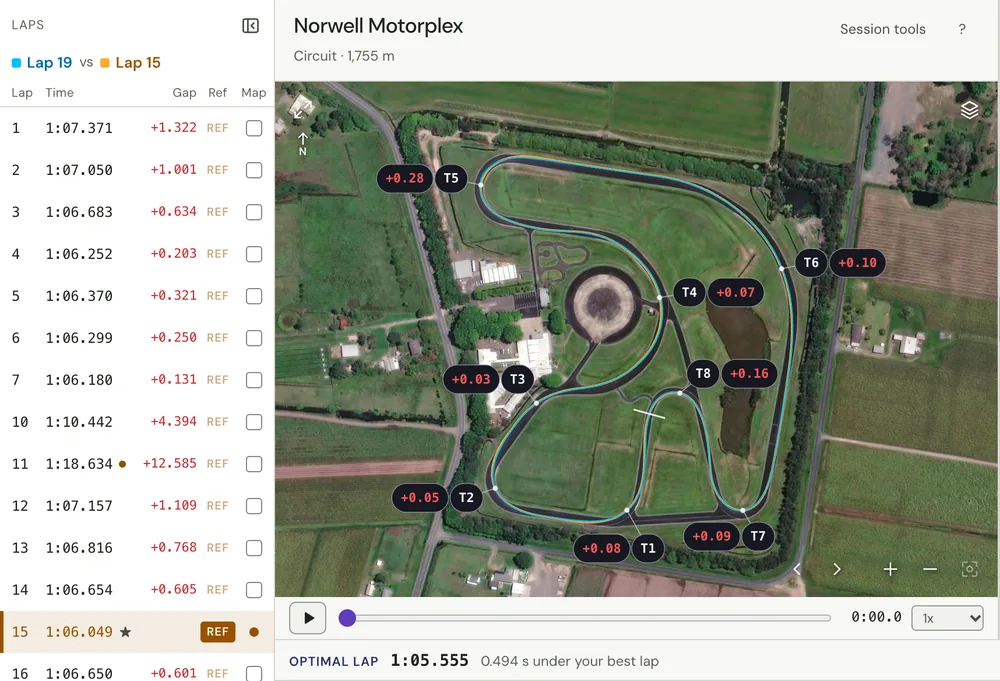
4. What does the speed trace show at those corners?
Read speed through the corners where the gap grows, for three things:
- Where the speed starts to fall: where you braked or lifted. A GPS logger can’t tell which.
- The lowest point: the minimum corner speed.
- The climb out: how early the speed rises again.
A lower minimum or a later climb on the typical lap shows where the time went. A RaceBox records GPS position and speed plus an accelerometer and gyroscope; it doesn’t record the brake pedal or throttle, so a braking point read from it is an estimate.

5. What else is in the RaceBox app?
The driving line on the RaceBox map or Google Maps, a G-G plot, lean angle analysis for motorcycles, and recorded video played in sync with the graph and driving line. Sessions can also be shared with other RaceBox users for comparison.
Look at these after the speed trace. Change one thing at a time, so the next session’s data shows whether it worked.
6. How do I analyse RaceBox data on a computer?
- Let the RaceBox app upload the session, then sign in at racebox.pro and open it under My Sessions.
- Export it as VBO or CSV. RaceBox recommends VBO for VBOX Circuit Tools, RaceChrono and others. GPX keeps only position and time, so it drops the g-force data.
- Open the file in your analysis tool. Purple Sector opens a VBO or CSV in a browser on a PC or Mac, and in Chrome or Edge it can read a Mini S or Micro over Bluetooth. See RaceBox data export.
Once it’s open, Purple Sector shows the gap to your best at every turn, the speed traces, a close-up of each corner with both lines, the Corner times tab and the optimal lap. The AI Coach debrief names the corner that cost the most and one thing to try there. See optimal lap time.

Questions
Is there RaceBox software for PC?
RaceBox’s app runs on iPhone (iOS 16 or later on the Australian App Store) and Android 10 or later, and the iPhone app also installs on Apple silicon Macs, though Apple marks it as not verified for macOS. On a Windows PC, sign in at racebox.pro in a browser, export the session as VBO or CSV and open it in analysis software.
RaceBox app or RaceChrono?
The RaceBox app works only with RaceBox hardware and is free, with cloud video storage as its listed in-app purchases. RaceChrono Pro is a paid phone app (A$29.99 on the Australian App Store) that uses a RaceBox Mini or Mini S as its top recommended external GPS. See lap timer apps compared.
Does the RaceBox app show a theoretical best lap?
RaceBox’s product pages and store listings don’t name one; they list sector times and lap comparison. Purple Sector works out an optimal lap from an exported VBO or CSV: your quickest run from each corner to the next, joined into one lap.
Which RaceBox export should I use?
VBO, the format RaceBox recommends for VBOX Circuit Tools and RaceChrono. CSV also works and has presets for video overlay tools. GPX drops the g-force data.
What GPS rate does a RaceBox record?
The Mini, Mini S and Micro have a 25 Hz GPS; the original RaceBox with a screen has 10 Hz. The Mini S and Micro store over 2 hours at 25 Hz or 5 hours at 10 Hz.
More: RaceBox data export · RaceChrono data analysis · Lap timer apps compared · Garmin Catalyst vs RaceBox vs AiM Solo 2 · Track day telemetry for beginners · How to compare laps
Sources, checked 24 October 2026
- RaceBox app: every lap with speed and g-force graphs, driving lines and sector times; two laps side by side; session overview; RaceBox map or Google Maps; G-G plot; lean angle analysis; synced video; sharing; live lap, sector and predicted times: racebox.pro/products/mobile-app
- RaceBox app on the Australian App Store: iOS 16 or later; installs on Apple silicon Macs, not verified for macOS; free, with cloud video storage as in-app purchases; needs RaceBox hardware: apps.apple.com/au/app/racebox/id1521988789
- Website export: My Sessions, export as CSV, VBO or GPX; VBO recommended for VBOX Circuit Tools and RaceChrono; CSV presets; GPX drops g-force; missing sessions: open the app online without the device: racebox.pro/info/session-export
- RaceBox Mini: 25 Hz: racebox.pro/products/racebox-mini
- RaceBox Mini S: 25 Hz; over 2 hours at 25 Hz or 5 hours at 10 Hz; accelerometer and gyroscope: racebox.pro/products/racebox-mini-s
- RaceBox Micro: 25 Hz; the same storage: racebox.pro/products/racebox-micro
- The original RaceBox: 10 Hz: racebox.pro/products/racebox
- RaceChrono Pro A$29.99 on the Australian App Store: apps.apple.com/au/app/racechrono-pro/id1129429340
- RaceChrono’s top recommended external GPS: the RaceBox Mini or Mini S: racechrono.com/support
- Purple Sector opens a VBO or CSV in a browser and reads a Mini S or Micro over Bluetooth in Chrome or Edge: purplesector.dev/guides/racebox-sessions
- Purple Sector’s optimal lap and Corner times tab: purplesector.dev/guides/optimal-lap-time