 Purple Sector
How to read AiM Solo 2 data
Read AiM Solo 2 data step by step: download over Wi-Fi, the lap list, Time Compare, speed at each corner and the split report's theoretical lap.
To read AiM Solo 2 data, download the session over Wi-Fi into Race Studio 3 and open it in Race Studio 3 Analysis. Load your best lap and one typical lap, then read the Time Compare graph under the speed trace: where it climbs, the typical lap is losing time. Check speed at those corners, then use the split report’s best theoretical and best rolling laps to see how much pace the session held.
Purple Sector is one of the tools on this page. Purple Sector has no commercial relationship with AiM or any other brand on this page.
What do I need?
- The Solo 2 or Solo 2 DL and a Windows PC with Race Studio 3, AiM’s free software for 64-bit Windows. On a Mac or phone, see AiM Solo 2 software and apps.
- Or the session’s
.xrkfile and a browser: Purple Sector opens it on a Mac or PC. See open AiM .xrk files.
The screenshots below are Purple Sector with a MyChron 5 session from a car at Queensland Raceway open, also an AiM .xrk file. The reading steps are the same for a Solo 2.
1. How do I get the session onto the computer?
- Set the Solo 2’s Wi-Fi to AUTO or ON. In AUTO it switches on when the vehicle stops and off when recording starts.
- In Race Studio 3, click the Wi-Fi icon and select the logger. AiM’s Solo 2 DL guide says the DL connects to a computer only over Wi-Fi.
- Open the Download tab, select the sessions and press Download. The page lists each file’s laps, best lap, date and size.
- Press the Analysis icon and double-click the session. Race Studio 3 adds every downloaded session to its Analysis database.
2. Which laps can I compare?
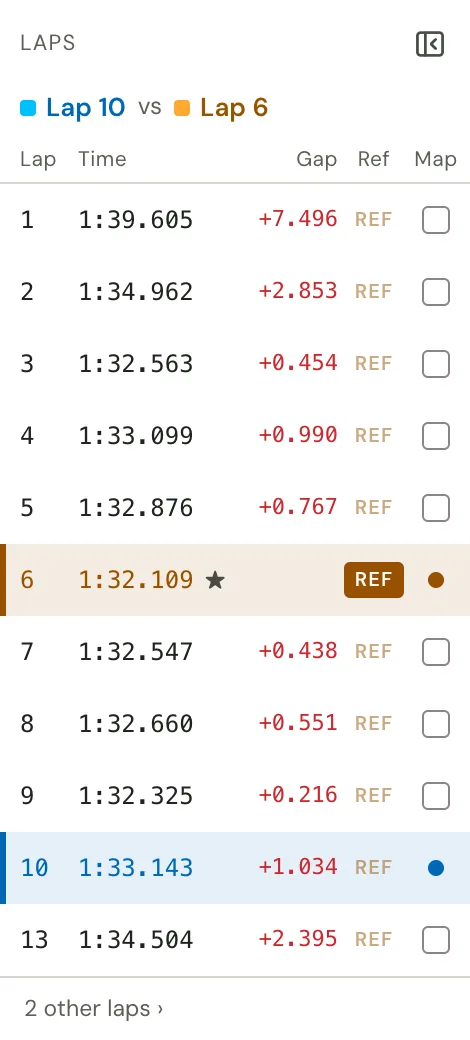
The Laps report lists the laps by lap time and graphs GPS speed against distance. Leave out the out lap, the in lap and any lap with traffic, a spin or a yellow flag; AiM’s split report already leaves in and out laps out by default.
3. Where is the time going?
Load your best lap as the reference and one typical lap from the same session. Under the main graph, the Time Compare graph shows the time difference between the reference lap and the others; it can show as Differential or as Gap. Where it climbs, the typical lap is losing time; where it falls, it’s gaining. Read it against distance: Race Studio 3 can plot graphs against distance or time.

4. What does the speed trace show at those corners?
At the corners where the time gap climbs, read GPS speed for three things:
- Where the speed starts to fall: where you braked or lifted. GPS and the motion sensors can’t tell which.
- The lowest point: the minimum corner speed.
- The climb out: how early the speed rises again.
A lower minimum or a later climb on the typical lap shows where the time went. In distance mode the splits show on the graph, and double-clicking one zooms to it. AiM’s current spec for the Solo 2 is GPS position and speed 25 times a second, plus a 100 Hz 6-axis inertial platform.
5. What does the split report add?
The split report divides each lap into segments and times each one, lap after lap. The colourised report shades good values green and bad ones red. The split report also gives a best theoretical and a best rolling lap:
- Best theoretical: your best split times from any laps, added up.
- Best rolling: the fastest lap you really drove over consecutive splits, not necessarily from start/finish line to start/finish line.
A big gap between your best lap and the best theoretical means the pace is there in pieces. The split that’s furthest from its best on typical laps is the one to work on. See optimal lap time.
6. What about the Solo 2 DL’s engine data?
The Solo 2 DL adds the car’s ECU data over CAN, RS232 or K-Line. Look at those channels after the speed trace. A GPS lap timer on its own records position, speed and time, not the brake pedal or throttle.
Can I read it without Race Studio 3?
Yes. Open the .xrk or .xrz in Purple Sector in a browser on a Mac or PC: it shows the gap to your best at every turn, the speed traces, a close-up of each corner, the Corner times tab and the optimal lap. The AI Coach debrief names the corner that cost the most and one thing to try there.

Questions
How do I connect an AiM Solo 2 to my computer?
Over Wi-Fi: set the logger’s Wi-Fi to AUTO or ON, then click the Wi-Fi icon in Race Studio 3 and select it. By default the Solo 2 creates its own Wi-Fi network for the computer to join.
What is Time Compare in Race Studio 3?
The graph under the main graph that shows the time difference between the reference lap and the other loaded laps. Where it climbs, the compared lap is losing time.
What is the difference between best theoretical and best rolling?
Best theoretical adds up your best split times from any laps. Best rolling is the fastest lap you really drove over consecutive splits, which may not start at the start/finish line.
Does Race Studio 3 run on a Mac?
Not natively: it needs 64-bit Windows, and AiM doesn’t support Arm Windows. AiM says it can run in virtualised Windows, but on Arm systems talking to the logger is unlikely. See Race Studio 3 on a Mac.
Does AiM have video tutorials for Race Studio Analysis?
AiM’s documentation links Roger Caddell’s webinar series, including "Driver Performance Data Analysis" and "Detailed Cornering Analysis".
More: AiM Solo 2 software and apps · Open AiM .xrk files · How to read MyChron data · Race Studio 3 on a Mac · XRK to CSV · Optimal lap time
Sources, checked 24 October 2026
- Solo 2 DL: Wi-Fi only to the PC; AUTO or ON, and what AUTO does; the Wi-Fi icon; the Download tab; the Analysis icon; ECU data over CAN, RS232 or K-Line: dwls.aim-sportline.com/doc/eng/solo2/Solo2DL_user_guide_eng.pdf
- Solo 2: its own Wi-Fi network by default; the Download page lists laps, best lap, date, time and size: dwls.aim-sportline.com/doc/eng/solo2/Solo2_user_guide_eng.pdf
- Race Studio 3 Analysis: the database, the Laps report, Time Compare (Differential or Gap), splits in distance mode, the split report, best theoretical and best rolling laps, in and out laps left out, the colourised report: aim-sportline.com/docs/racestudio3/manual/html/analysis.html
- Solo 2: 25 Hz GPS and a 100 Hz 6-axis inertial platform: aim-sportline.com/en/products/solo2-solo2dl/index.htm
- Race Studio 3: 64-bit Windows; Arm Windows not supported; virtualised Windows possible; on Arm, talking to the logger is unlikely: aim-sportline.com/docs/racestudio3/manual/html/faq.html
- Roger Caddell’s webinars: aim-sportline.com/docs/racestudio3/manual/html/web-resources.html
- Purple Sector opens .xrk and .xrz in a browser: purplesector.dev/guides/mychron-aim-xrk-files
- Purple Sector’s optimal lap and Corner times tab: purplesector.dev/guides/optimal-lap-time